Turn customer feedback into proof you fixed things.
Verdyct reads a stream of open-text feedback — app reviews, support tickets, survey comments, NPS verbatims — and turns it into themes you can track, fix, and prove you fixed.
Instead of reading feedback once and moving on, Verdyct builds an evolving codebook, watches how each theme moves upload over upload, and measures whether the changes you ship actually move the numbers. It's built for product, support, and CX teams at growing companies — the gap between heavyweight enterprise platforms and one-off analysis tools.
Everything in Verdyct runs on one loop:
This guide walks the whole loop using a sample project — app-store reviews for a budgeting app called Spendwise.
Get going
Getting started
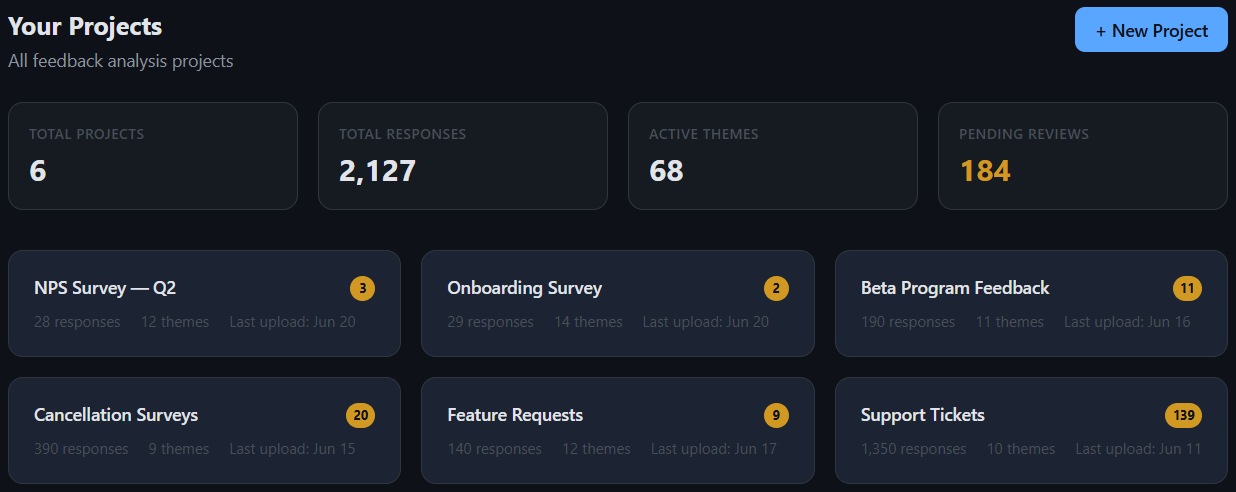
Signing in lands you on your projects workspace. Verdyct organizes feedback into projects — usually one per source or channel: app-store reviews, support tickets, a survey, an NPS pulse. Each card shows its response count, how many active themes Verdyct has found, and the last upload date. The tiles up top roll the workspace up: total projects, responses analyzed, active themes, and emerging themes awaiting review.
Create a project
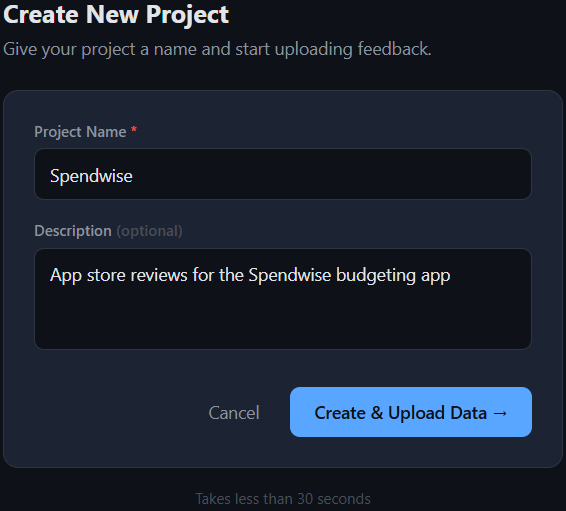
Give the project a name and an optional description, then choose Create & Upload Data. The description is just for your reference — it doesn't affect analysis. A project is a container for one feedback source that you add to over time; each new upload becomes another data point Verdyct compares against the last.
Upload feedback and map your columns
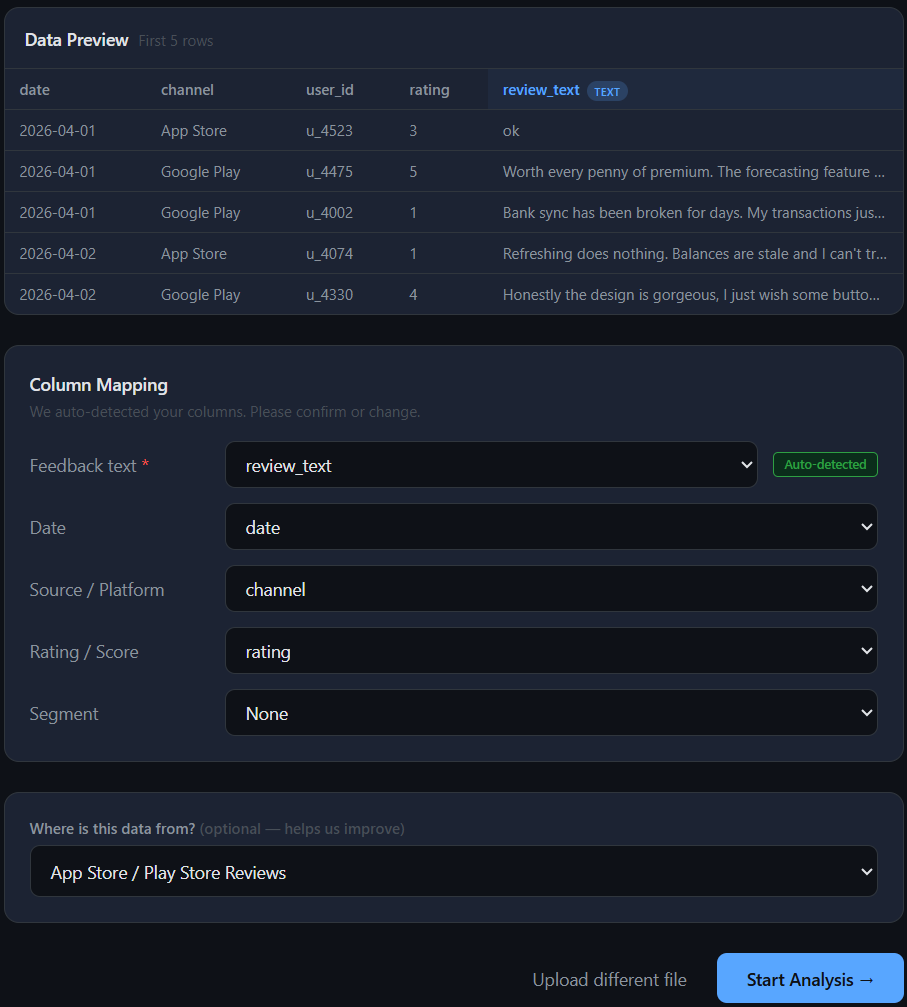
Verdyct previews your file and auto-detects the feedback column — here it correctly picked review_text (the green Auto-detected badge). Confirm or override it, map the optional fields (date, source, rating, segment), and choose Start Analysis.
How mapping works
- One required field: feedback text, one column. If your file has several open-text columns, pick the richest.
- Auto-detect reads the text, not the header name — it picks the column with the most substantial responses, so it works even if your header is named something unexpected.
- Blank rows are skipped; very short ones ("ok", "fine") are kept but flagged low-context, so they don't distort themes.
- Up to 1,000 rows per upload — by design. Verdyct tracks how feedback moves over time, so each upload is a time-slice it compares against the last. Upload in the batches your feedback actually arrives in — a week or month of reviews, a ticket export — rather than dumping everything at once. Lower-volume sources just mean smaller, less frequent uploads; the comparison still works.
What happens next
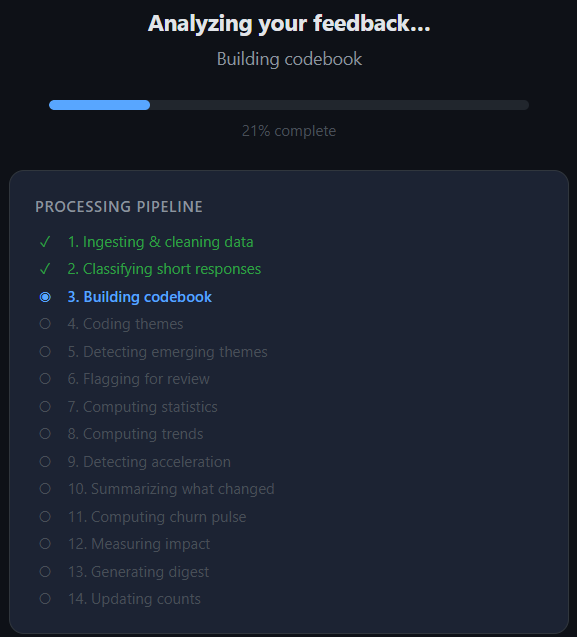
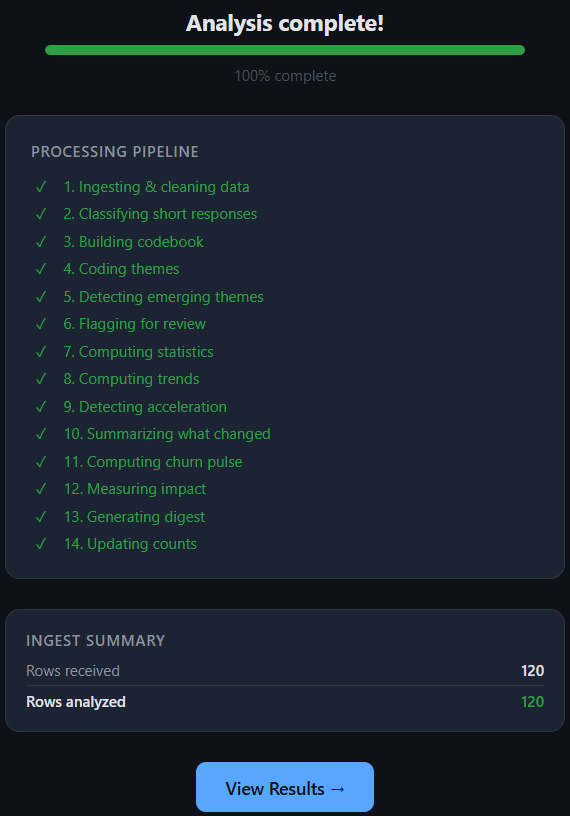
Verdyct runs your feedback through a multi-stage pipeline — cleaning the data, building a codebook of themes, coding every response against it, detecting emerging and accelerating themes, computing statistics and sentiment trends, measuring impact, and generating a digest. It takes well under a minute for a typical upload.
When it finishes, the ingest summary confirms exactly how much was processed. Here all 120 rows were analyzed — short, low-context responses are kept and flagged rather than dropped, so your counts stay honest.
See it
The dashboard
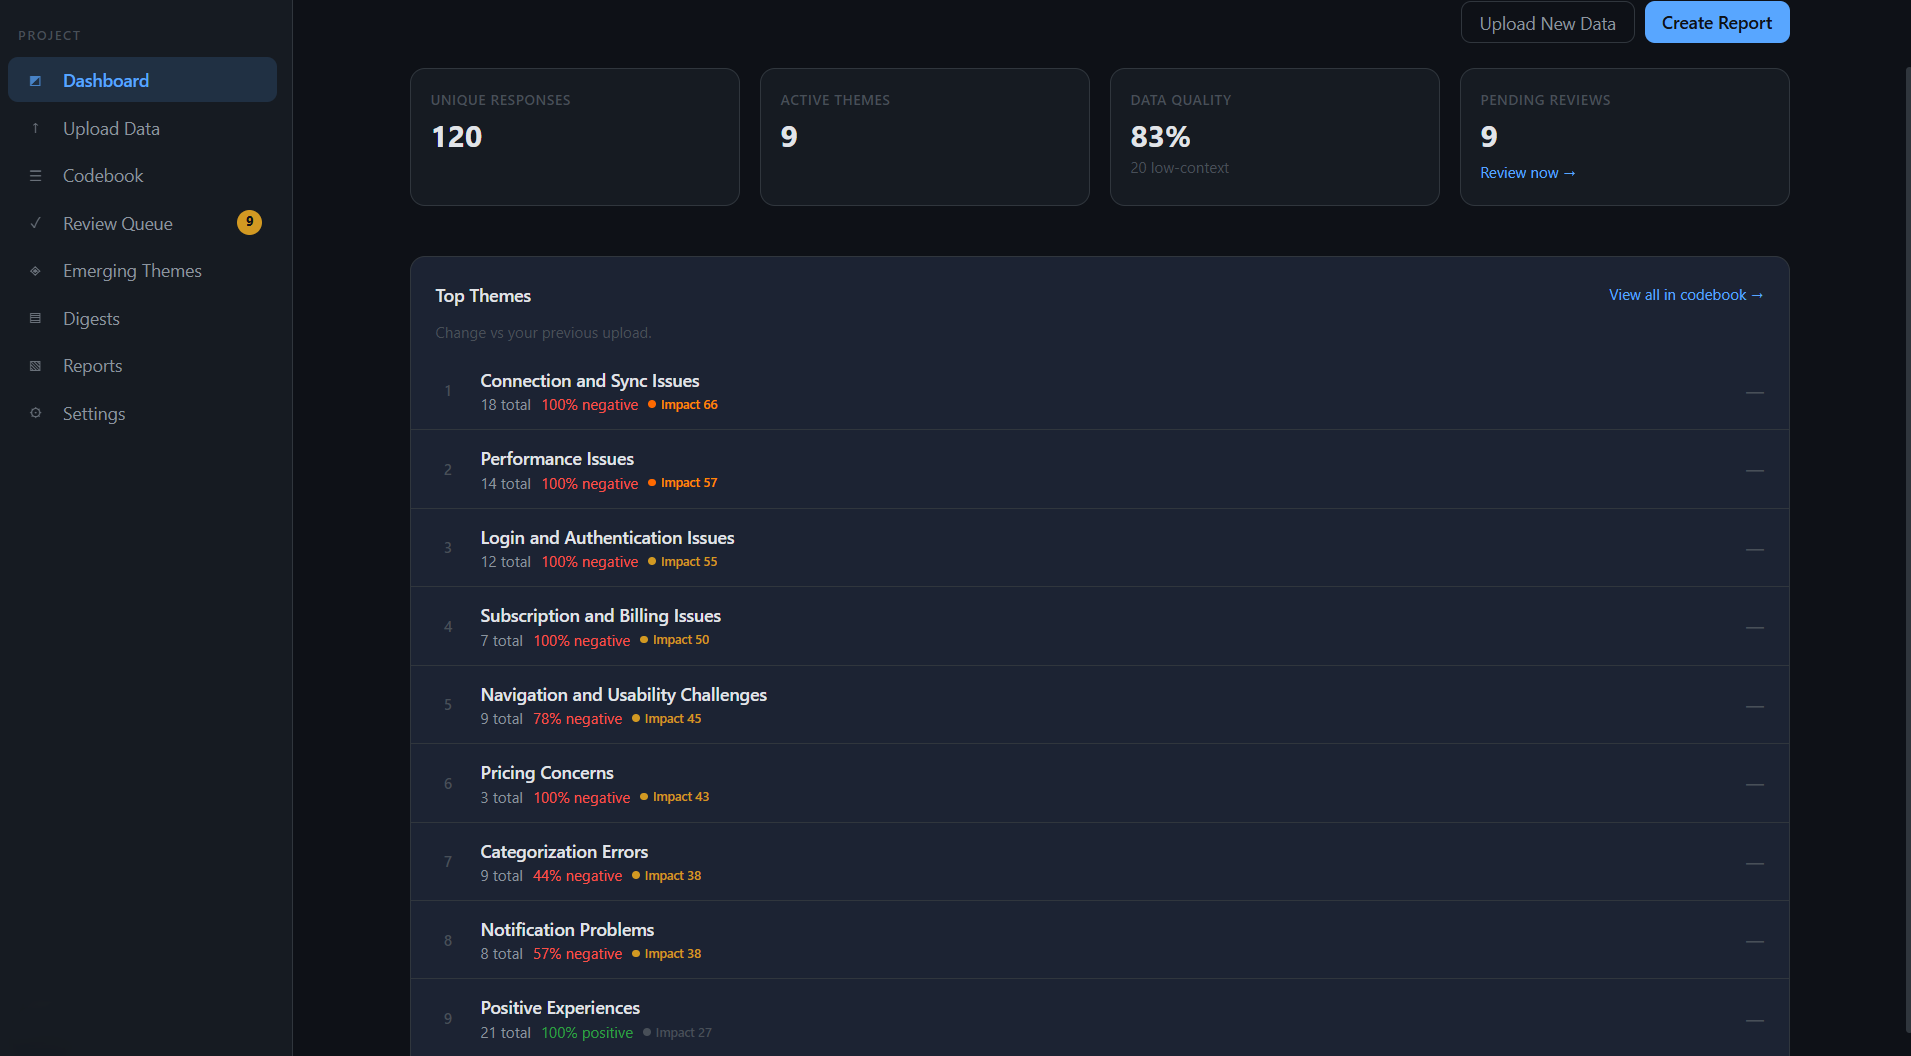
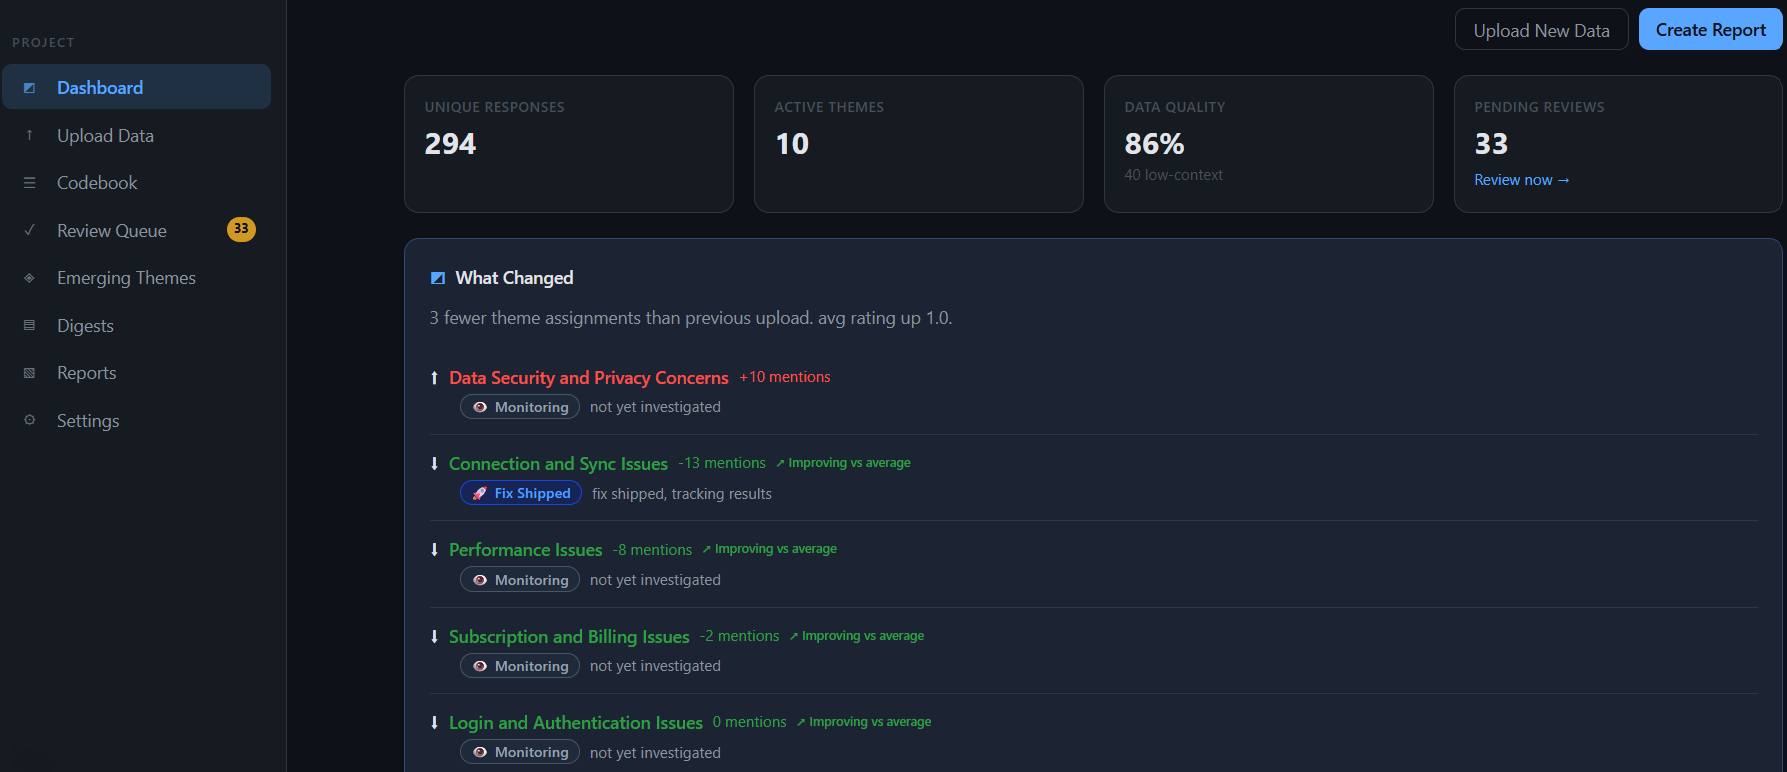
After analysis, the dashboard is your project's home. The tiles across the top give you the shape of the feedback at a glance: unique responses analyzed, active themes found, data quality (the share of responses substantial enough to code confidently), and pending reviews — emerging themes awaiting sign-off.
Below, Top Themes ranks what's driving your feedback by Impact — a 0–100 score combining how many people raised a theme, how negative it is, and how urgent the signals are. Each row shows mentions, sentiment, and impact, so the most pressing issues sit at the top. Here, Connection and Sync Issues leads at Impact 66 — 18 mentions, all negative.
The codebook
The codebook is the full list of themes Verdyct found, each its own evolving definition. It opens sorted by volume (most-mentioned first) — note this differs from the dashboard's Top Themes, which ranks by impact, so the same themes appear in a different order depending on what you're looking for. Every card carries its mention count, sentiment, the kinds of feedback inside it, how severe it is, and where it sits in its lifecycle. Click any theme to open its evidence.
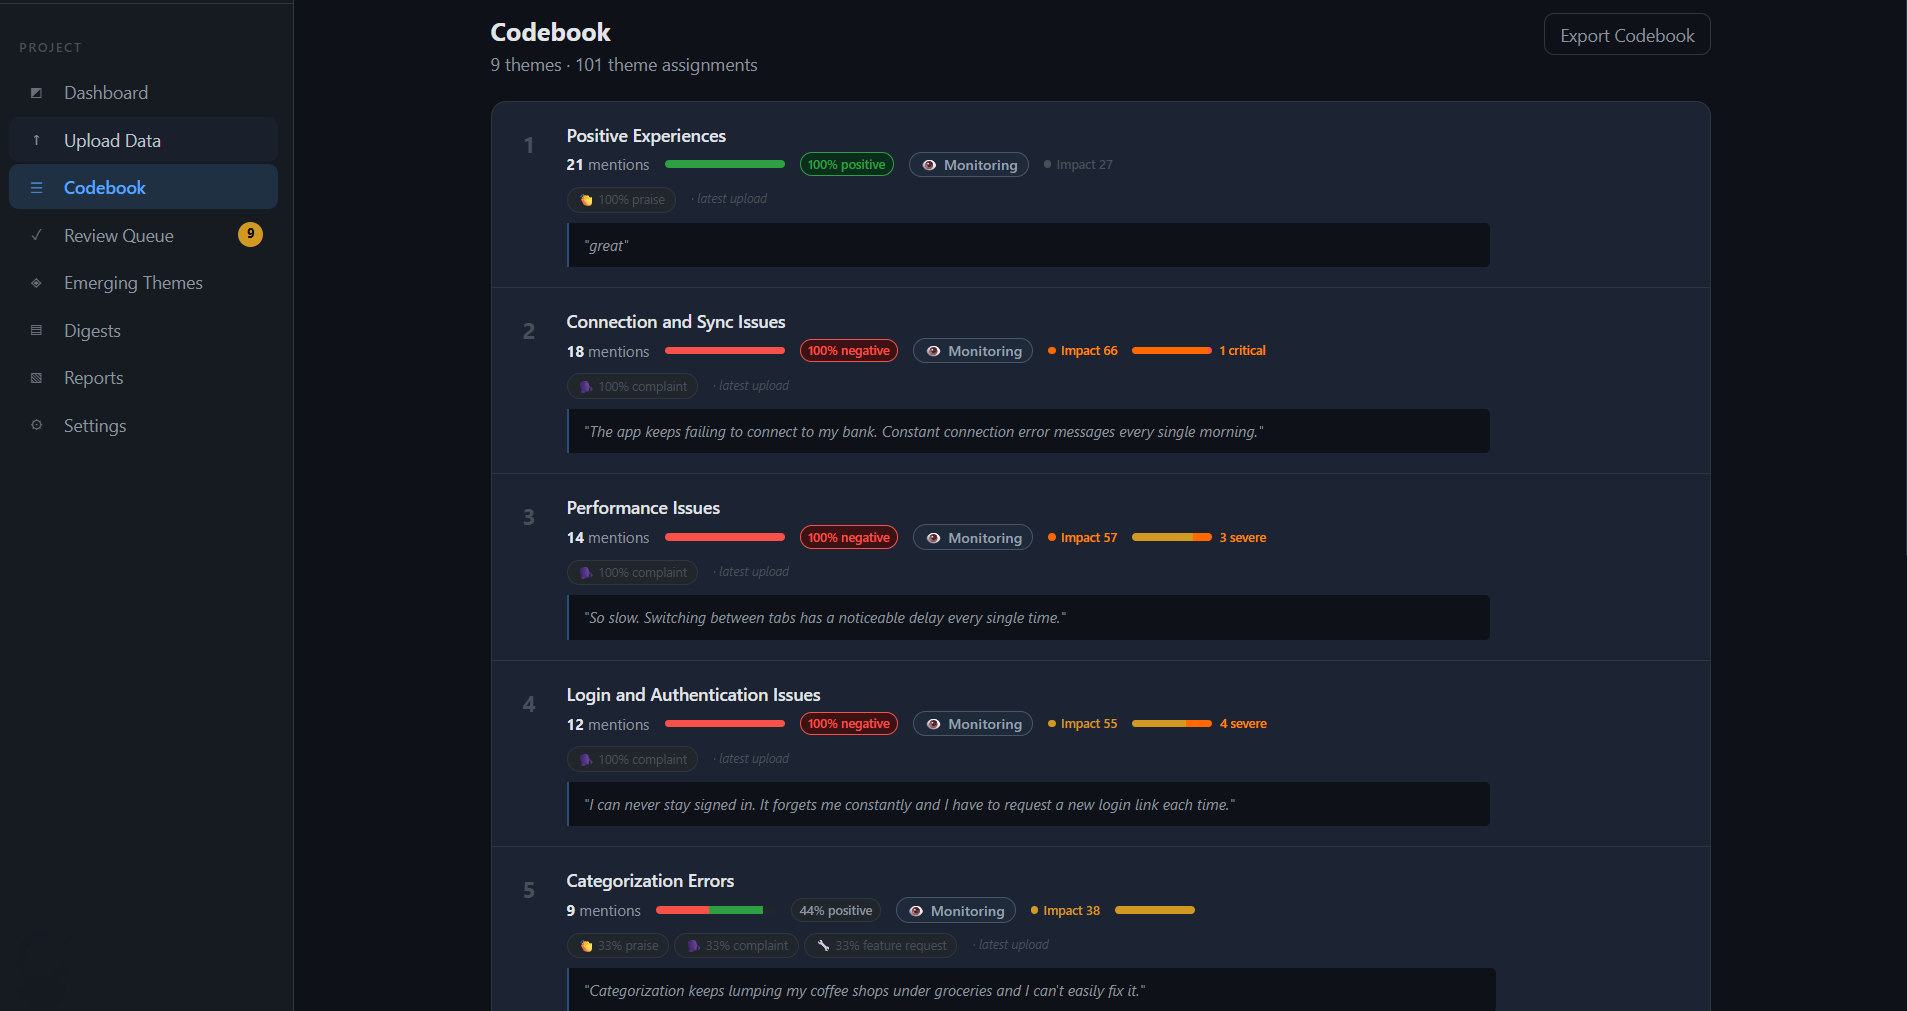
Reading a theme card
- Sentiment bar & label — the share of mentions positive vs negative. Watch the mixed ones: Categorization Errors is 44% positive, a theme where users both complain and request.
- Intent chips — what kind of feedback this is: complaint, praise, feature request, question, or churn signal (highlighted, because it means someone's threatening to leave). A theme can be a blend — 33% praise / 33% complaint / 33% feature request.
- Severity — how serious the underlying issues are (critical / severe counts), read from the language itself, independent of how many people raised them.
- Lifecycle status — every theme starts in Monitoring; you move it through to a fix later.
How impact is scored
Impact (0–100) is a composite, not just a count. It weighs volume, negativity, severity, churn risk, and how fast a theme is accelerating. That's why a smaller but sharply negative theme can out-rank a larger mild one — impact surfaces what's pressing, not just what's frequent. Use impact to triage; use mention count when you care about reach.
Reading the evidence
Click any theme to open its evidence — every response Verdyct placed there, with the matched phrases highlighted. This is the auditable core of the product: you can always see why a response was coded into a theme, not just that it was.
Each response carries its source, date, star rating, and Verdyct's read of it — sentiment (the colored dot), severity, and intent. Sort by recency or confidence, and filter by intent to isolate, say, just the feature requests inside a theme.
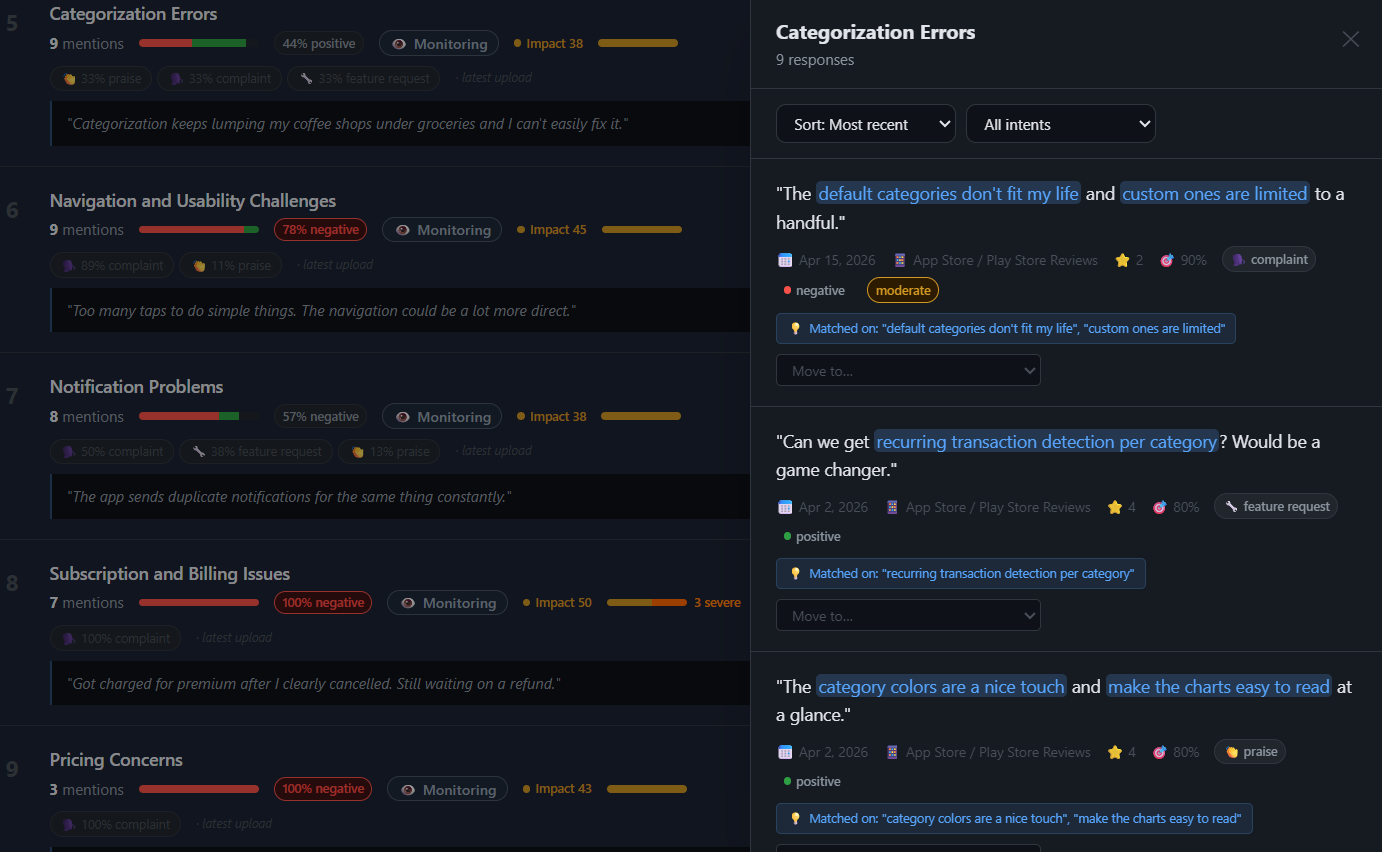
Sentiment comes from the words, not the stars
The feature-request and praise responses here are 4-star and read positive, while the complaint reads negative — Verdyct judges each response on its text. That's why a 4-star review that says "love it, but sync is broken" still lands in a problem theme: the rating is metadata, the meaning is in the writing.
The review queue
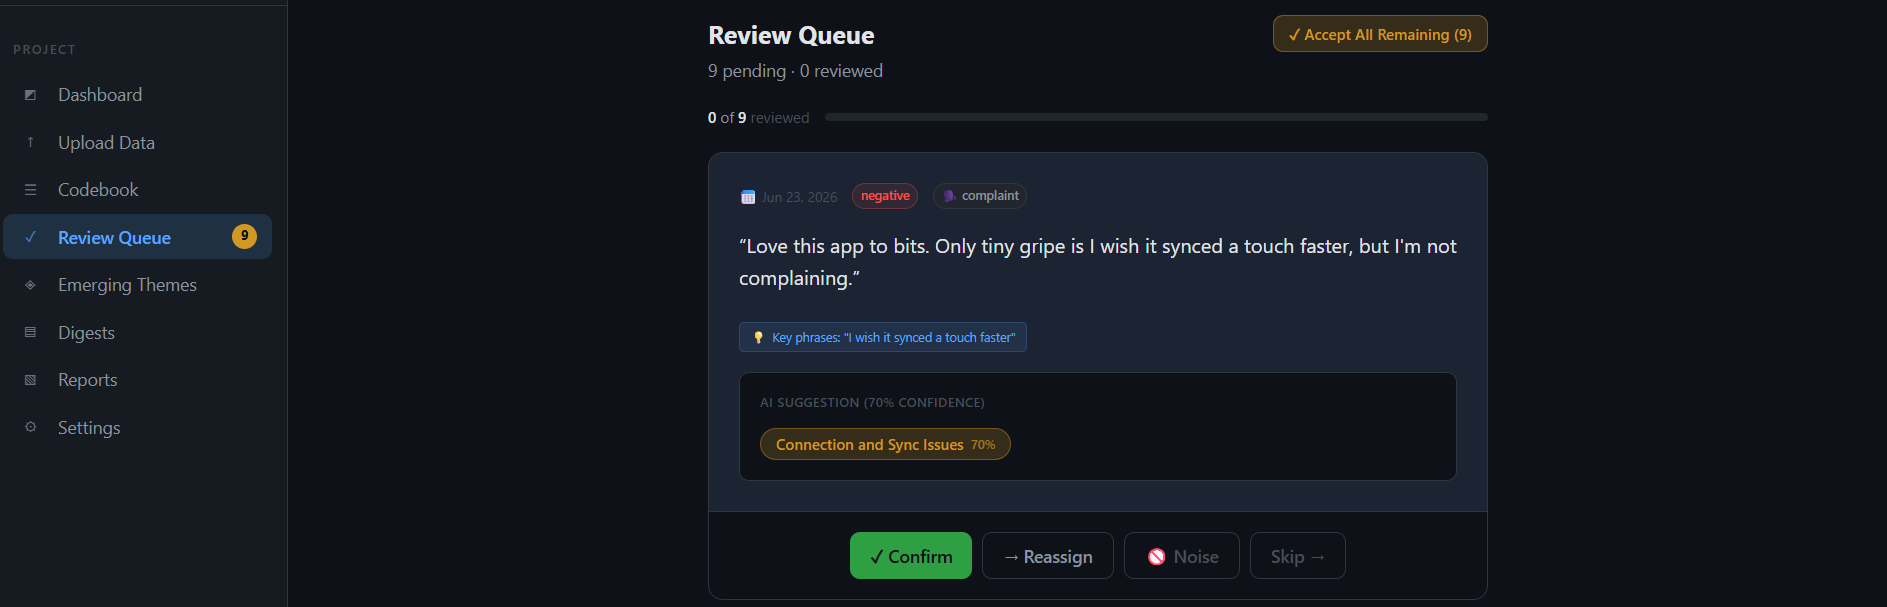
Verdyct codes most responses automatically, but when it's not confident it sets them aside here rather than guessing. Each card shows the response, the phrase Verdyct keyed on, and its suggested theme with a confidence score — so you only weigh in on the genuinely ambiguous ones.
Take this card: a glowing review that ends with a sync gripe. Verdyct read the complaint and suggested Connection and Sync Issues at 70% — a fair but uncertain call. Confirm it, Reassign to a better theme, mark it Noise if it isn't real feedback, or Skip for later. Short on time? Accept All Remaining clears the queue at once.
Change & warning signals
The real power shows up on the second upload and beyond, when Verdyct can compare. Add a new batch the same way — Upload New Data, map, analyze — and the dashboard starts telling you what moved.
What Changed summarizes the delta against your previous upload: which themes rose or fell, how sentiment shifted, and which themes are newly worsening or improving. Each row pairs a mention delta with a sentiment qualifier ("improving vs average," "worsening vs average") so you can tell a volume change from a sentiment change at a glance.
Churn Pulse
When responses carry leave-intent — "switching to a competitor," "cancelling my subscription," "deleting the app" — Verdyct classifies them as churn signals and surfaces a Churn Pulse on the dashboard: the number of churn signals in the latest upload and the themes driving them. It's the earliest hard signal that a problem is costing you users, not just goodwill.
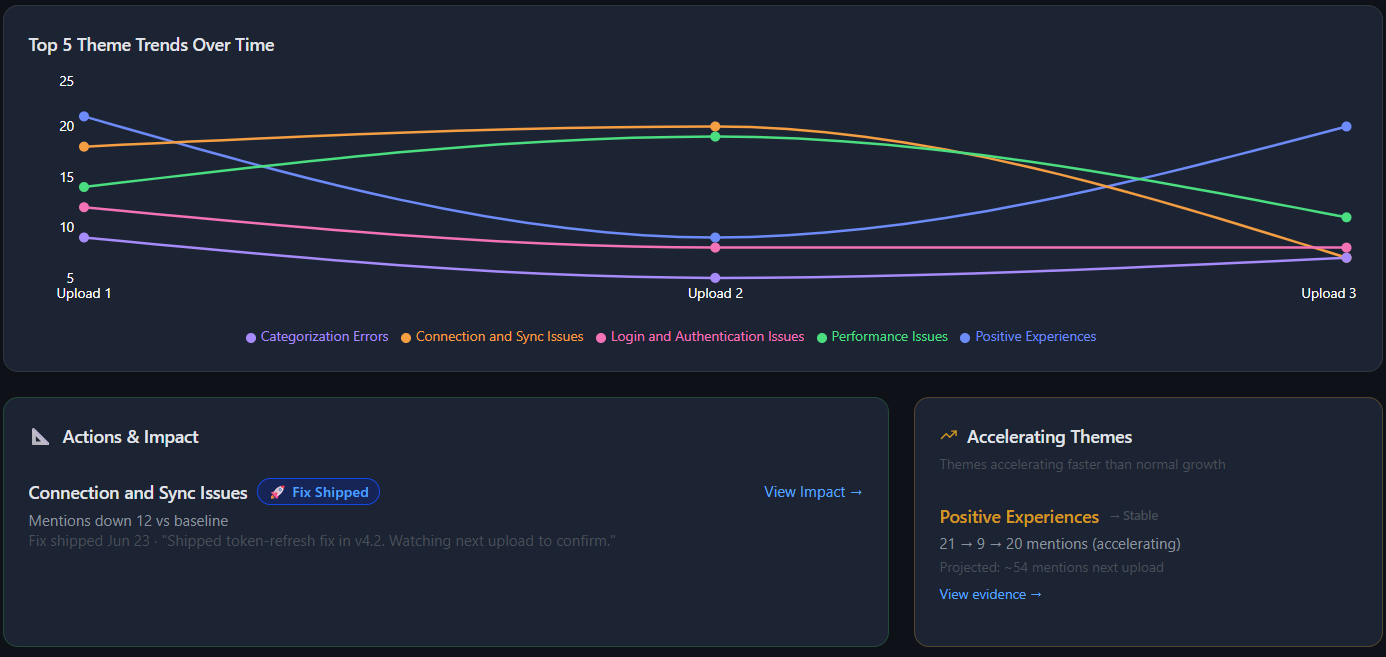
Accelerating Themes flags themes growing faster than their normal rate — the early-warning view. Acceleration is sentiment-agnostic: it catches a problem spiking and a positive theme taking off, with a projection for the next upload.
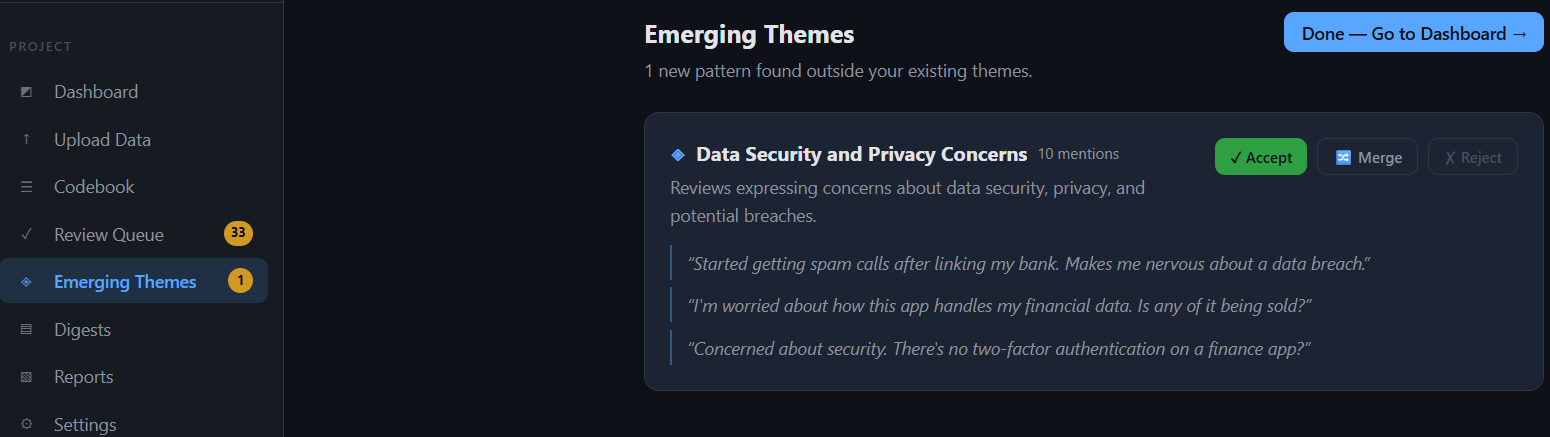
Emerging Themes is where Verdyct surfaces patterns that don't fit any existing theme — new problems forming before you'd notice them by hand. Here a cluster of data-security complaints appeared that none of the nine existing themes covered. Review it with the evidence in front of you, then Accept it as a new theme, Merge it into an existing one, or Reject it.
Fix it
Tracking a fix
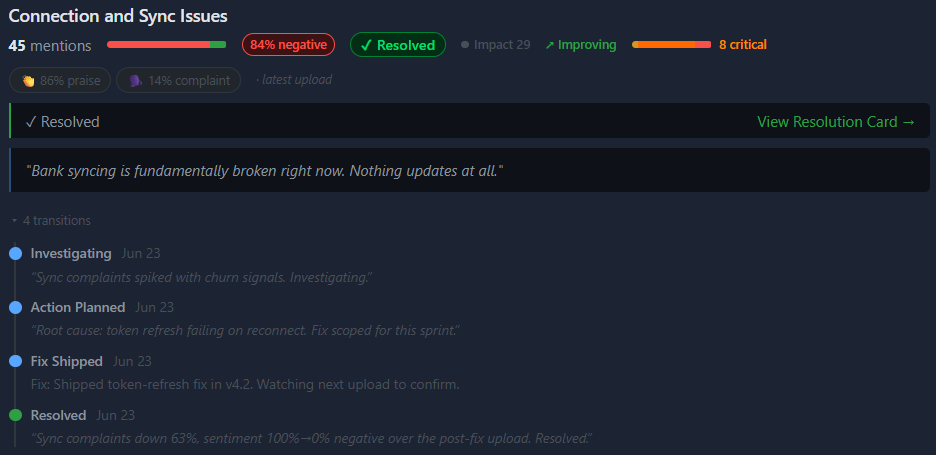
Once you've decided to act on a theme, Verdyct tracks it through a lifecycle — Monitoring → Investigating → Action planned → Fix shipped → Resolved — and every transition is logged with a timestamp and your note. The result is a complete audit trail of what you did and when, attached to the theme itself.
Below, Connection and Sync Issues has been moved to Fix Shipped at its worst point — 38 lifetime mentions, all negative, Impact 83. Moving a theme to Fix Shipped freezes a "before" baseline: the state Verdyct measures the recovery against on the next upload.

After the next upload confirms the recovery, move the theme to Resolved. Verdyct records the resolution alongside the earlier transitions and generates a resolution card from the before/after data.
Two ways to read a resolved theme
A resolved card shows lifetime totals — every mention the theme ever collected, including the early negative ones — so its headline sentiment stays mostly negative even after a successful fix. The recovery itself is measured over the fix window (before vs after the fix), which is what the impact report and resolution card show. Both are true; they're just different windows.
Prove it worked
The resolution card
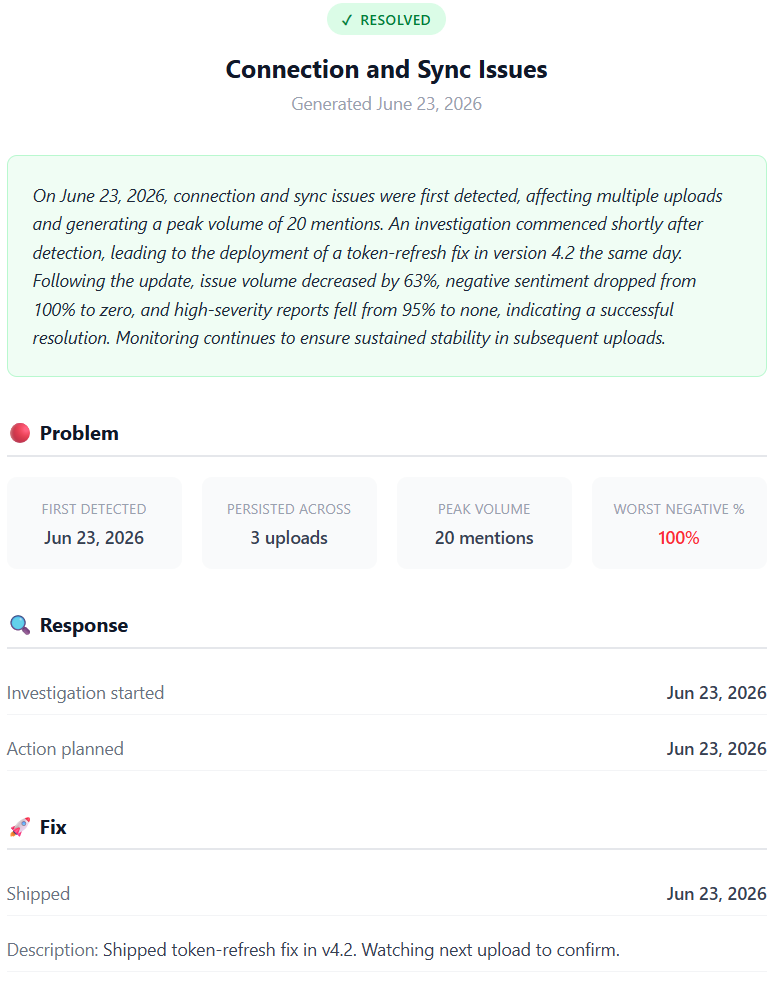
This is what the whole loop builds toward. When you resolve a theme, Verdyct freezes a resolution card — a self-contained before/after of the fix, written up automatically. It opens with a plain-language summary of what happened, the problem at its peak, and the response timeline.
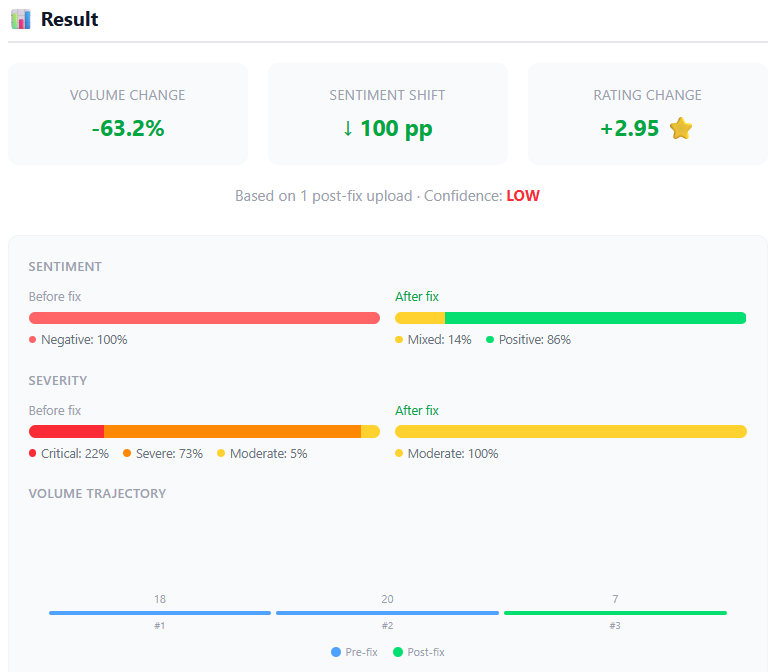
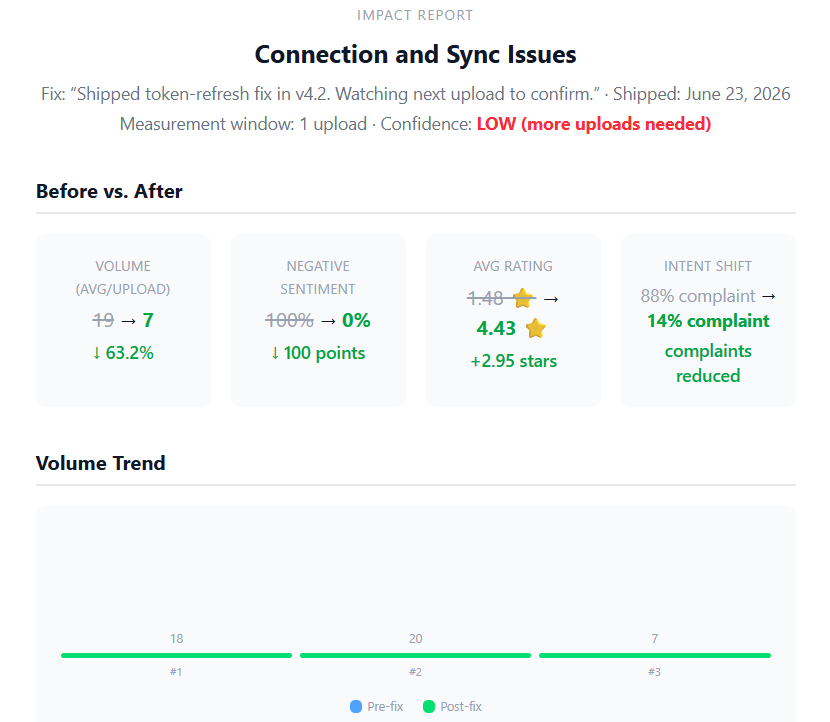
The result panel quantifies the change: volume down 63%, negative sentiment from 100% to zero, average rating up nearly three stars, and severity collapsing from mostly critical/severe to moderate. The volume trajectory shows the rise-then-drop across uploads.
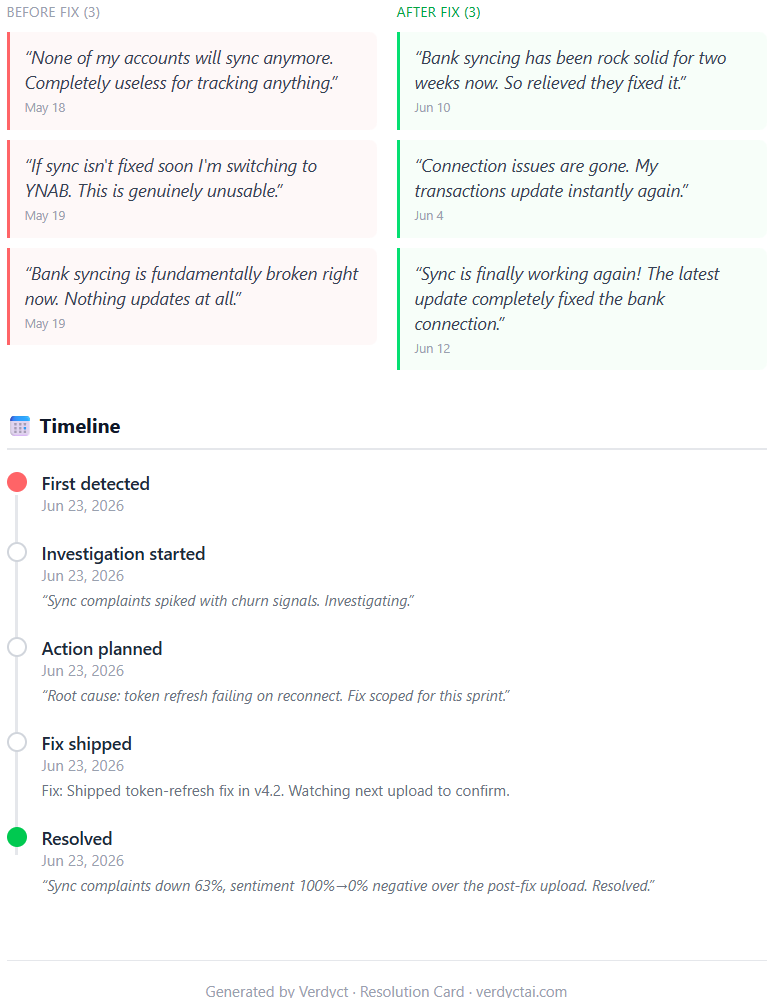
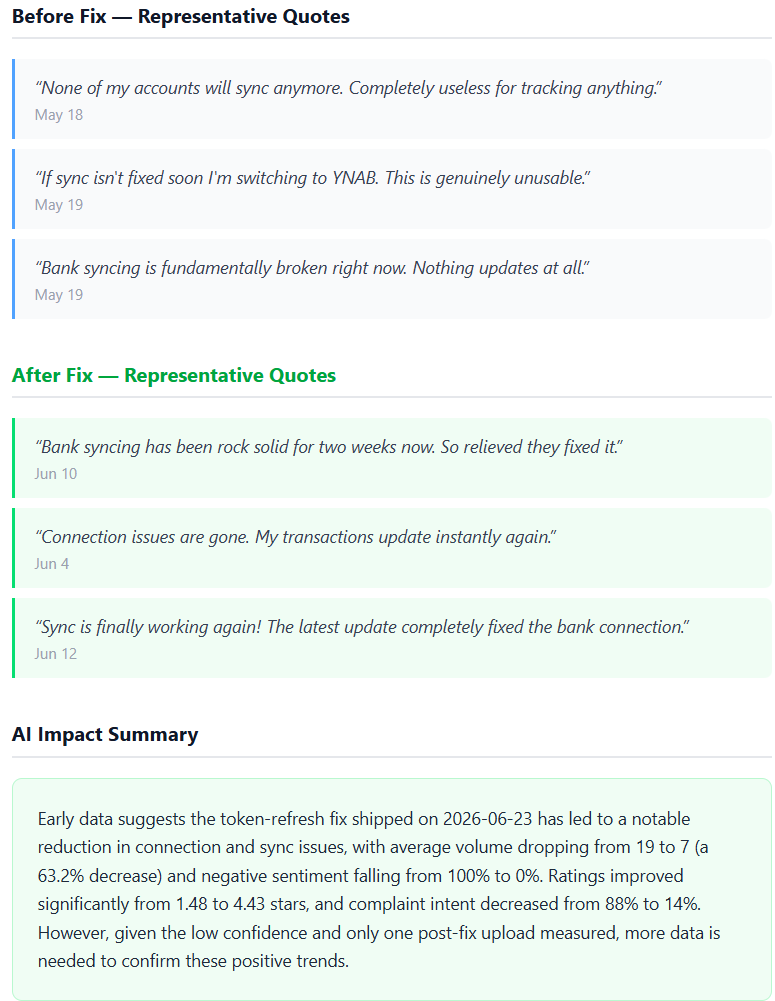
It closes with representative quotes from before and after the fix, side by side, and the full lifecycle timeline. The card carries the Verdyct name and your domain in its footer — it's built to be exported and shared with stakeholders.
Honest confidence
Notice the card is labelled Confidence: LOW — based on 1 post-fix upload. Verdyct doesn't declare victory on thin data. The more post-fix uploads confirm the trend, the higher the confidence climbs — so the number you share is one you can stand behind.
The impact report
Where the resolution card is a frozen snapshot, the impact report recomputes live — it keeps measuring as new uploads arrive, so you can watch a fix hold (or regress) over time. It shows the same before/after structure: the four headline deltas, the volume trend, representative quotes, and an auto-written impact summary that states the numbers and flags the confidence level explicitly.
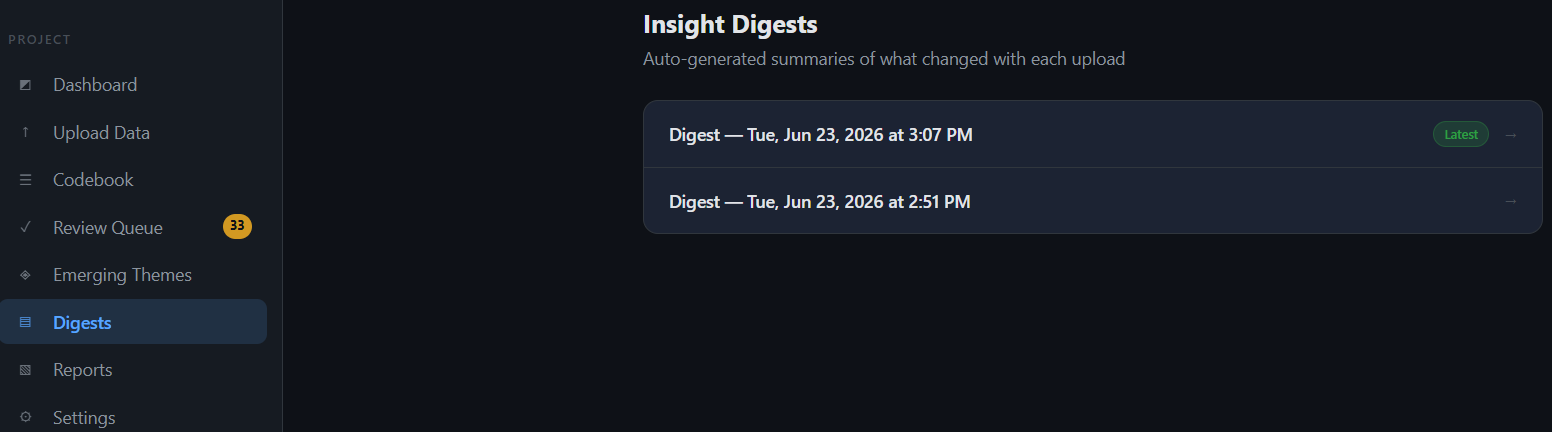
Digests
Every upload that produces changes generates an Insight Digest — a timestamped, frozen summary of what moved: themes that rose or fell, sentiment shifts, new emerging themes, and churn signals. Unlike the dashboard, which always reflects the latest state, each digest is a permanent snapshot, so you build a running history of how your feedback evolved upload over upload. Open any digest to revisit exactly what changed at that point in time.
Exports & reports
The work doesn't get trapped in Verdyct. Four reports export as polished, shareable documents: the Codebook (every theme and its definition), the Digest (a point-in-time change summary), the Impact Report, and the Resolution Card. You'll find the export and view actions right where the data lives — the Export Codebook button on the codebook, and the View Impact and View Resolution Card links on the relevant theme. Each is designed to hand to a stakeholder as-is.
Reference
FAQ & details
What feedback sources work?
Any source of open-text feedback in a CSV: app-store reviews, support tickets, survey comments, NPS verbatims, sales notes, and more. You tell Verdyct the source type at upload so it reads the feedback in context.
Can Verdyct analyze more than one text column?
Analysis runs on a single feedback column per upload — you map exactly one. If your file has several open-text fields, pick the richest one. Other columns (date, rating, source, segment) are kept as metadata for filtering and trends.
How much can I upload at once?
Up to 1,000 rows per upload. Because Verdyct compares uploads over time, the intended pattern is regular batches matching how your feedback arrives, rather than one large dump.
What happens to very short or blank responses?
Blank responses are skipped and don't count toward your totals. Very short ones are kept but flagged low-context, so they're visible without distorting your themes — which is why data quality is usually below 100%.
What does it cost?
Verdyct is free at launch.
How is my data handled?
See the privacy policy at verdyctai.com/privacy for how feedback data is stored and processed.